Student change report for Bloom assessments
Print
Modified on: Tue, 23 Apr, 2024 at 11:31 AM
To view the changes in a student’s Bloom assessments over time
1. Navigate to the Bloom tab and select the option Student change report

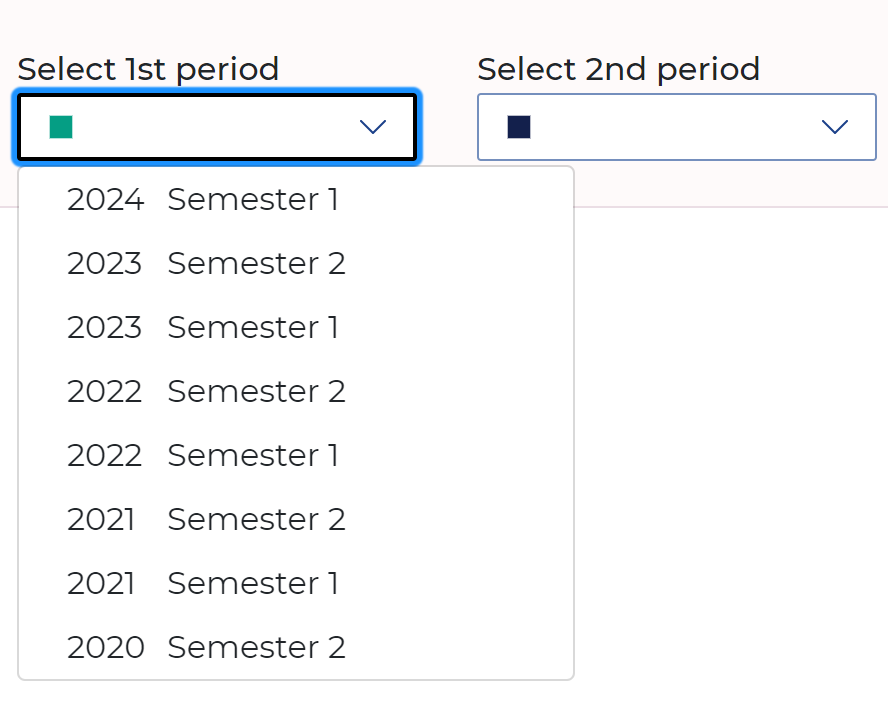
2. Select the assessment period i.e. what year/s and semester/s you want to compare in the 1st period and 2nd period drop down menus.
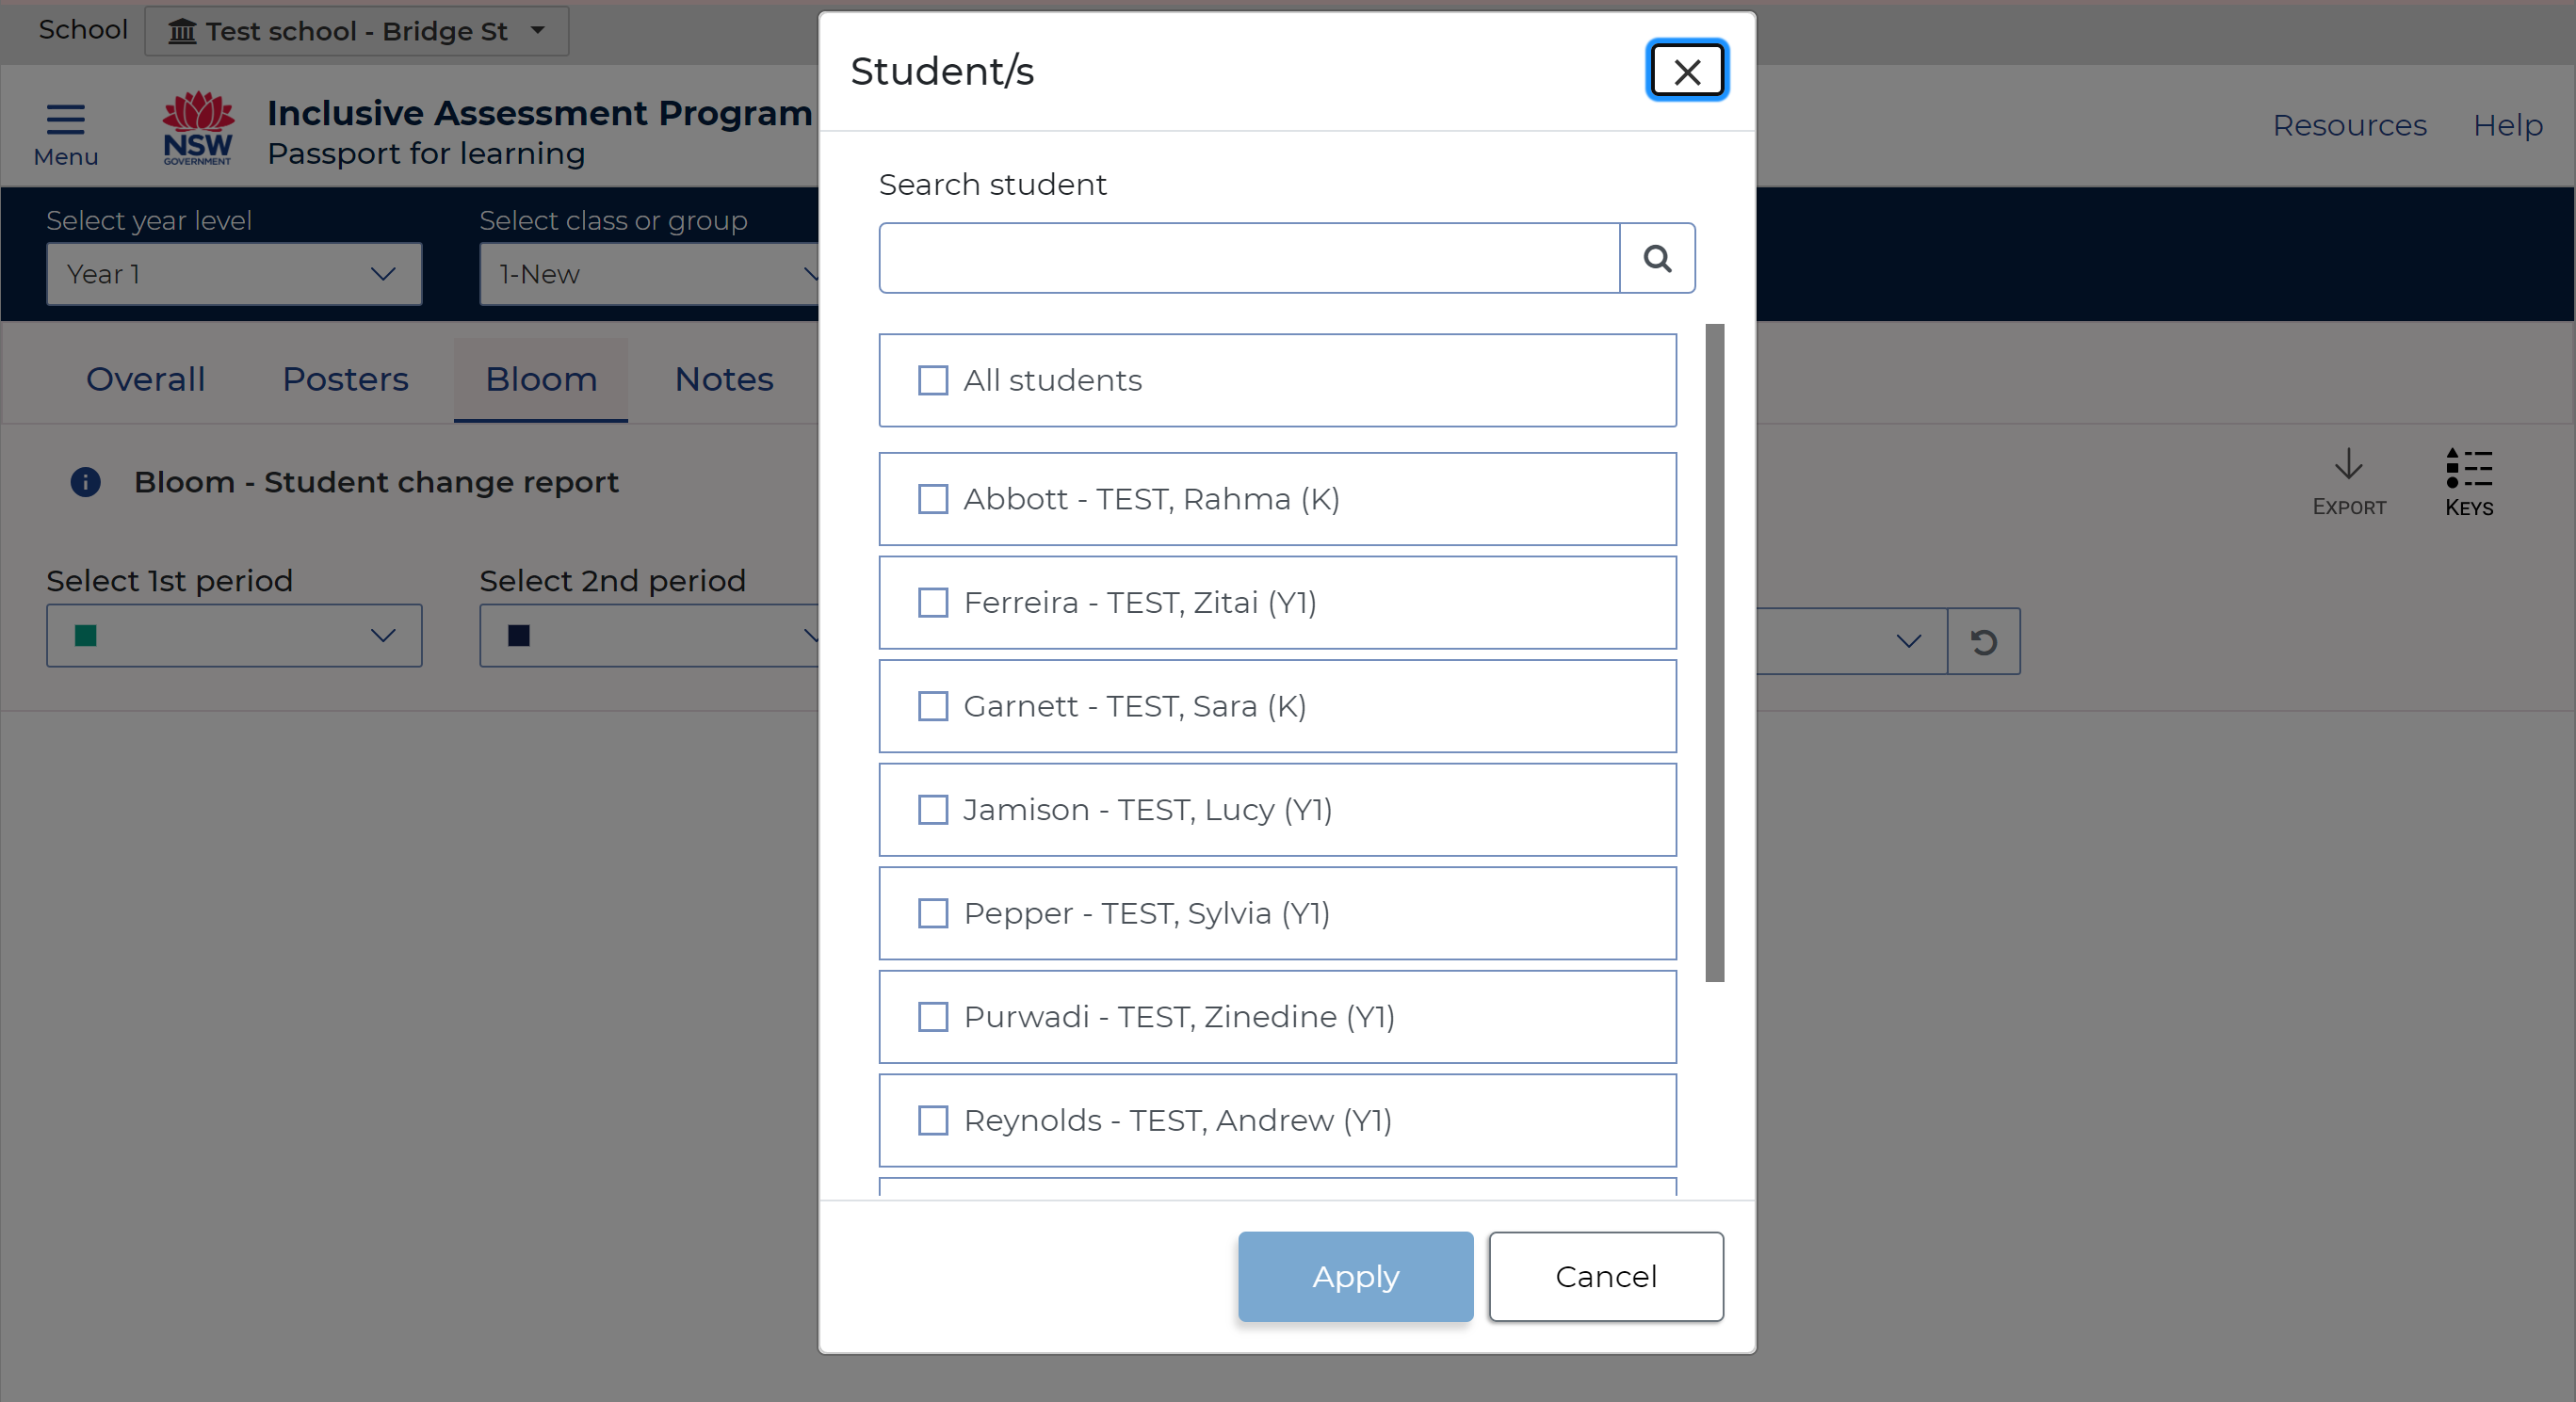
3. Select the student. You can select a specific student, multiple students or all students. Students can be searched by first or last name.
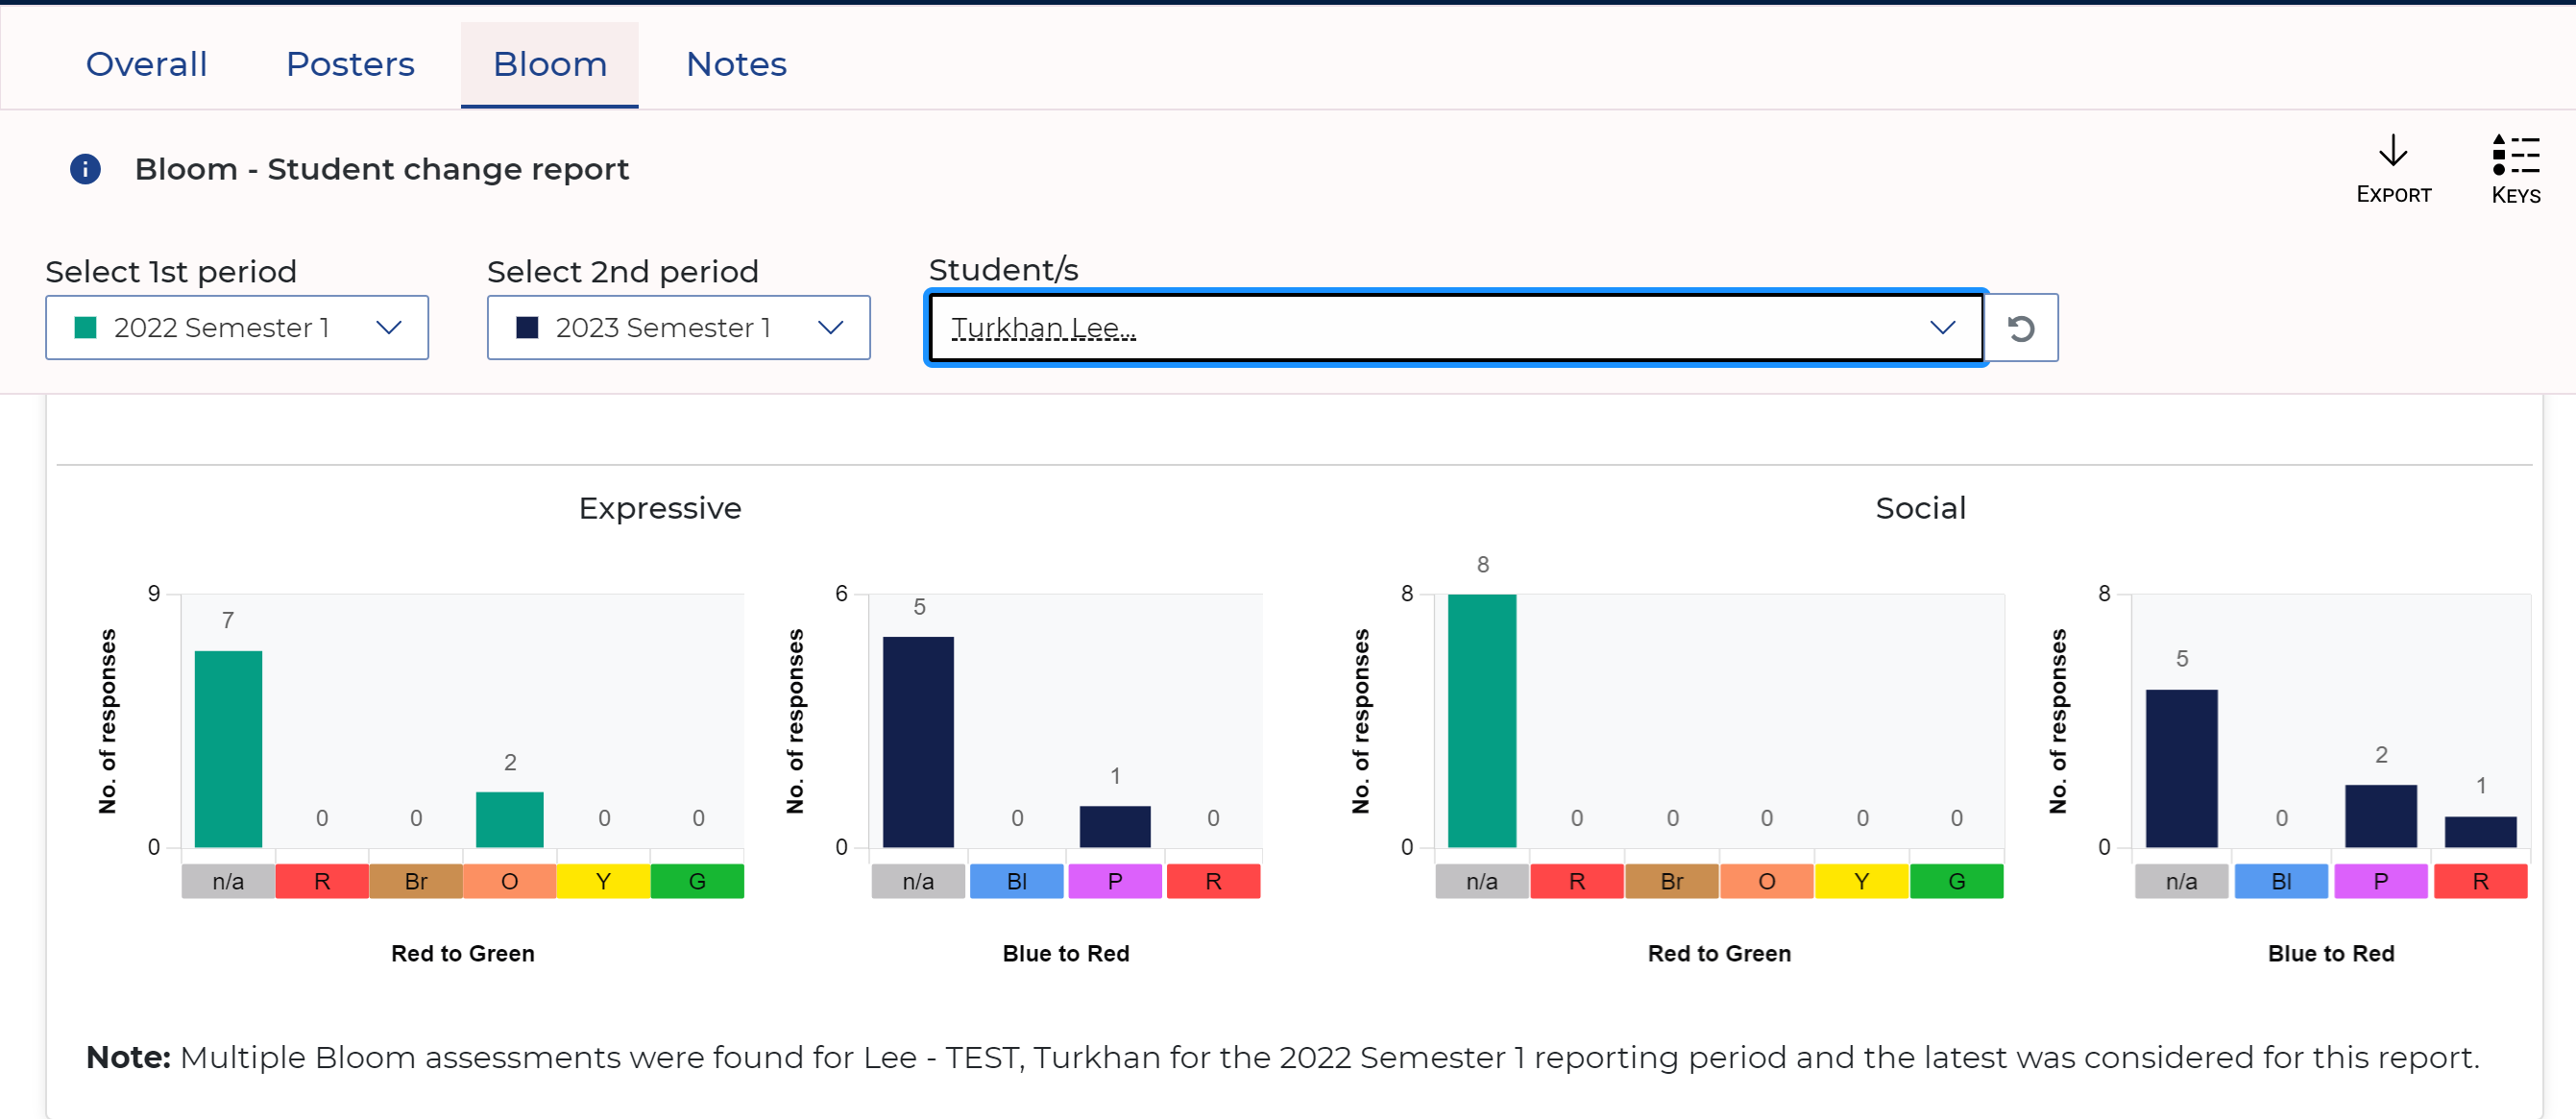
4. Bloom data is displayed in a bar graph format per student for the selected assessment periods. The legend to the right of the student’s name shows the colour attributed to each assessment period.
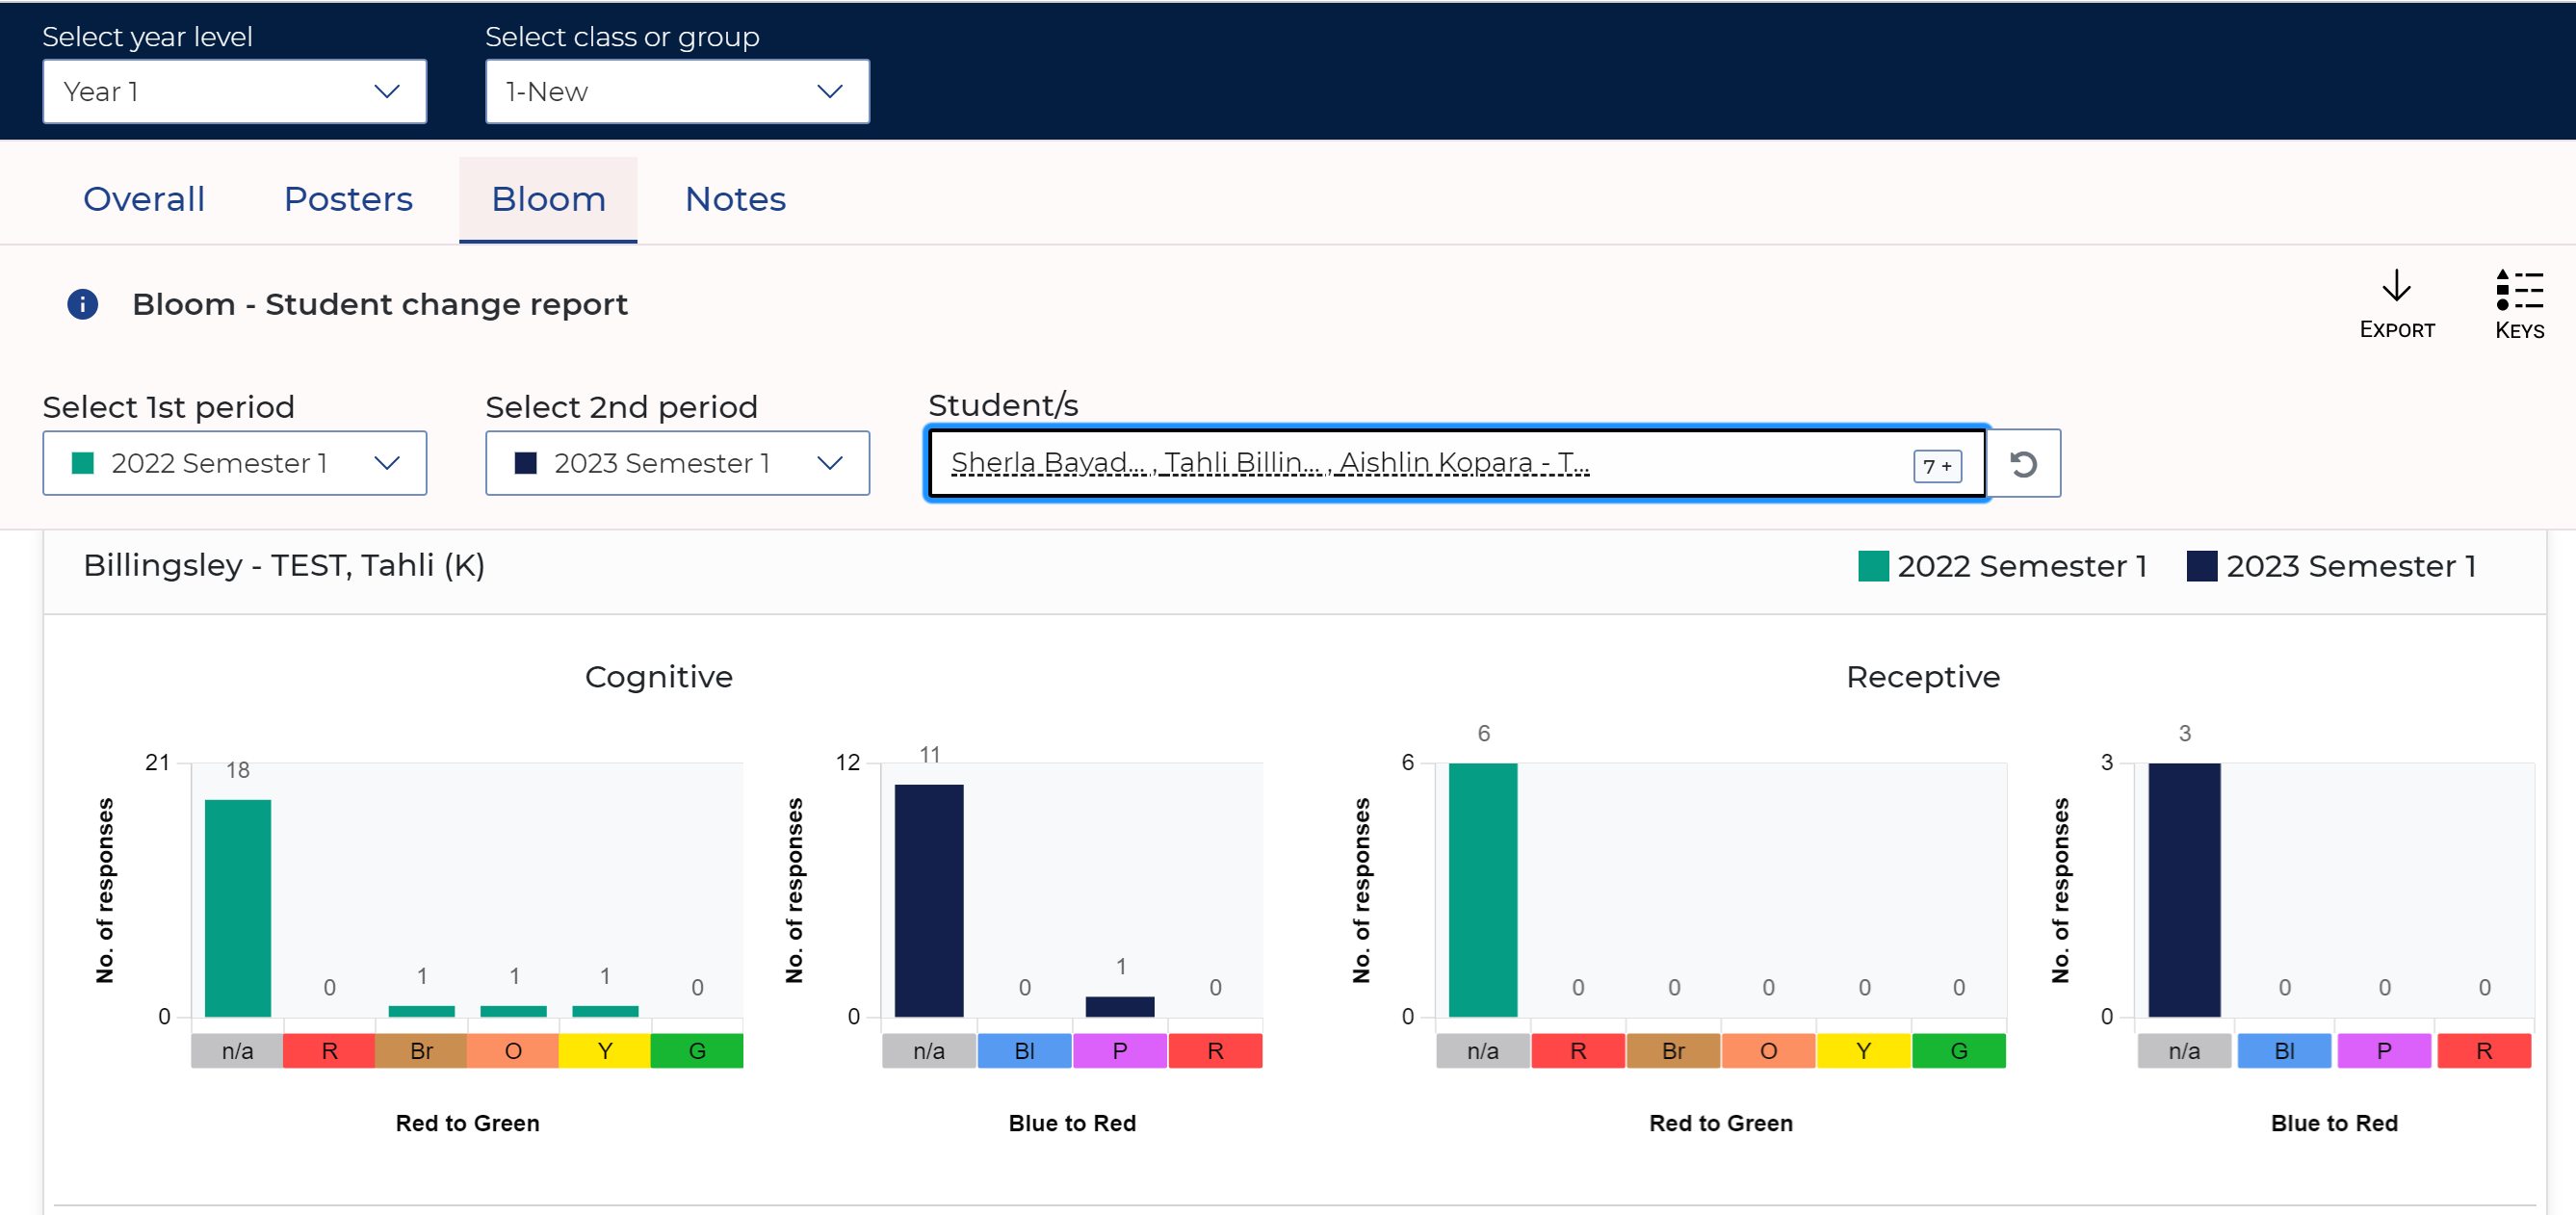
5. Key points to note here:
Last modified bloom assessment record is displayed for each assessment period.
If the assessment type for both periods is Blue-Red then the data for both assessment periods will be displayed across 4 colours along the x-axis, one for each colour (Blue, Purple, Red) and a grey one for unanswered questions.
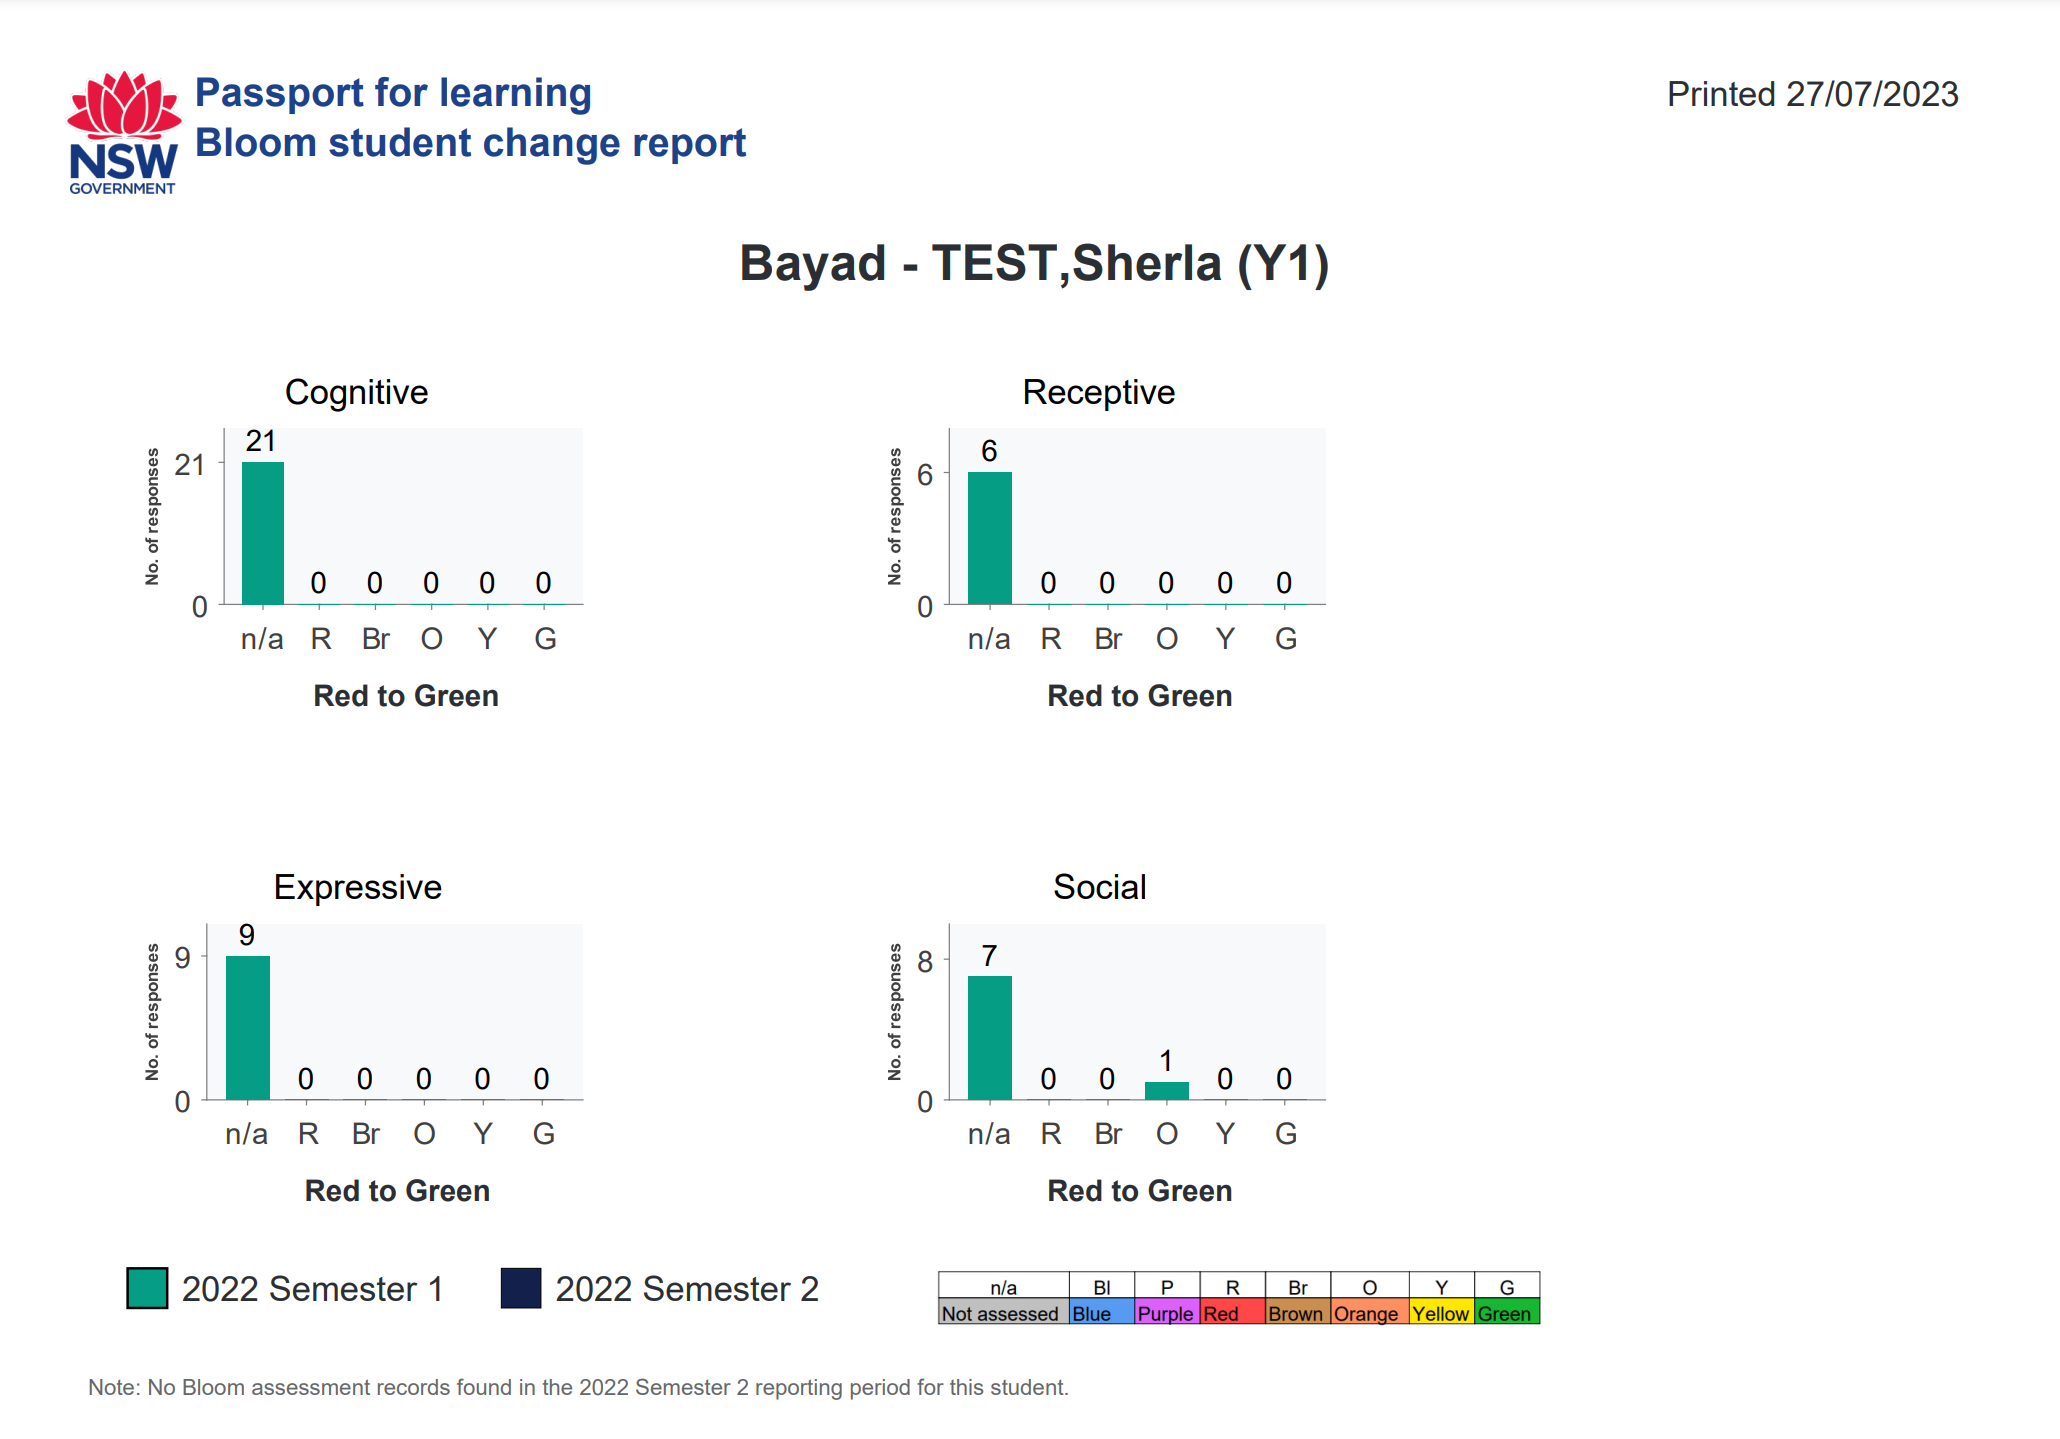
If the assessment type for both the periods is Red-Green then 6 graphs are displayed, one for each domain with the data for both the periods plotted in the graph. X-axis of the graph would have the colours (Red, Brown, Orange, Yellow, Green) and Grey for unanswered questions.
If the assessment type for one period is Blue-Red and for other Red-Green then 8 graphs are displayed, two in each domain with the data for both the periods plotted in the graph. X-axis for the Bloom records would be their corresponding colours (Blue, Purple, Red, Brown, Orange, Yellow, Green) and Grey for unanswered questions.
6. When multiple students are selected, data for each student is displayed down the page. Navigate your view using the scroll bar on the right of the screen.
7. Click the Keys button on the top right of the screen to view the legend for the Bloom assessment colours.

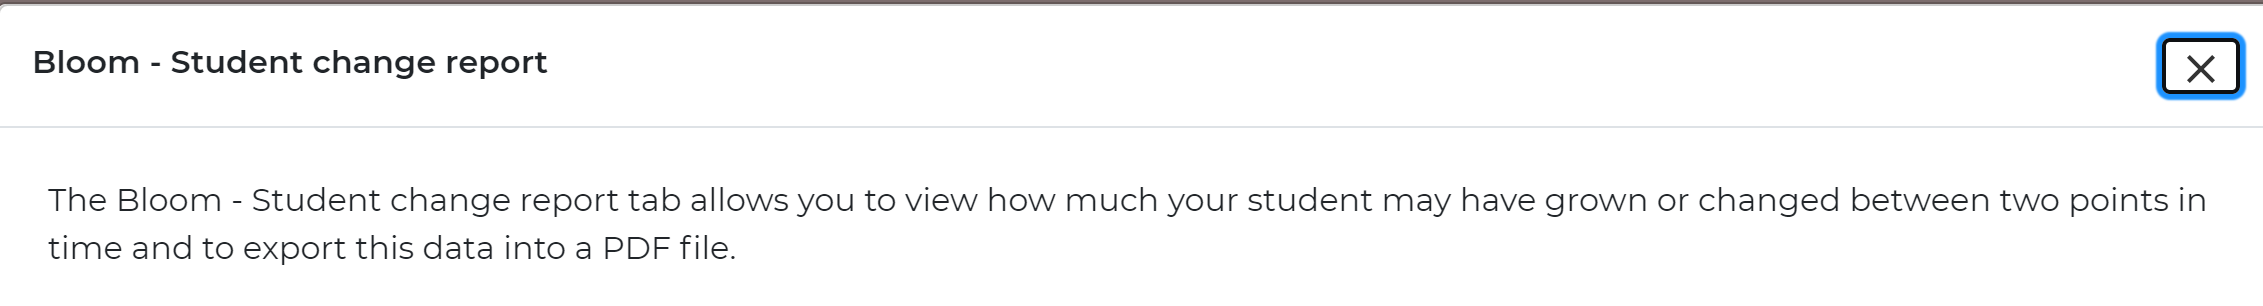
8. The information icon next to Bloom - Student change report at the top centre of the screen provides an explanation of the purpose of the report and notes that it can be printed in PDF format.


9. The information icon next to Bloom - Student change report provides instructions on using the report.

10. You cannot select both the assessment periods with the same Semester Year value.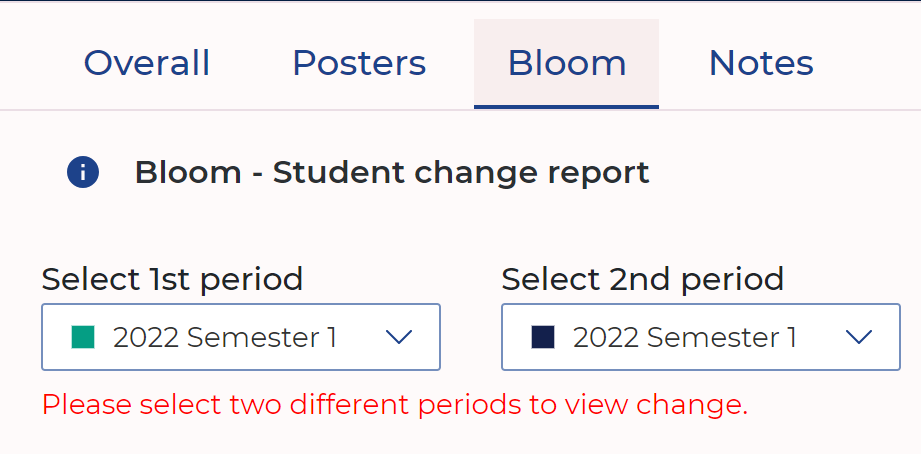
11. If there are no Bloom records found for the selected assessment period then this message is displayed:
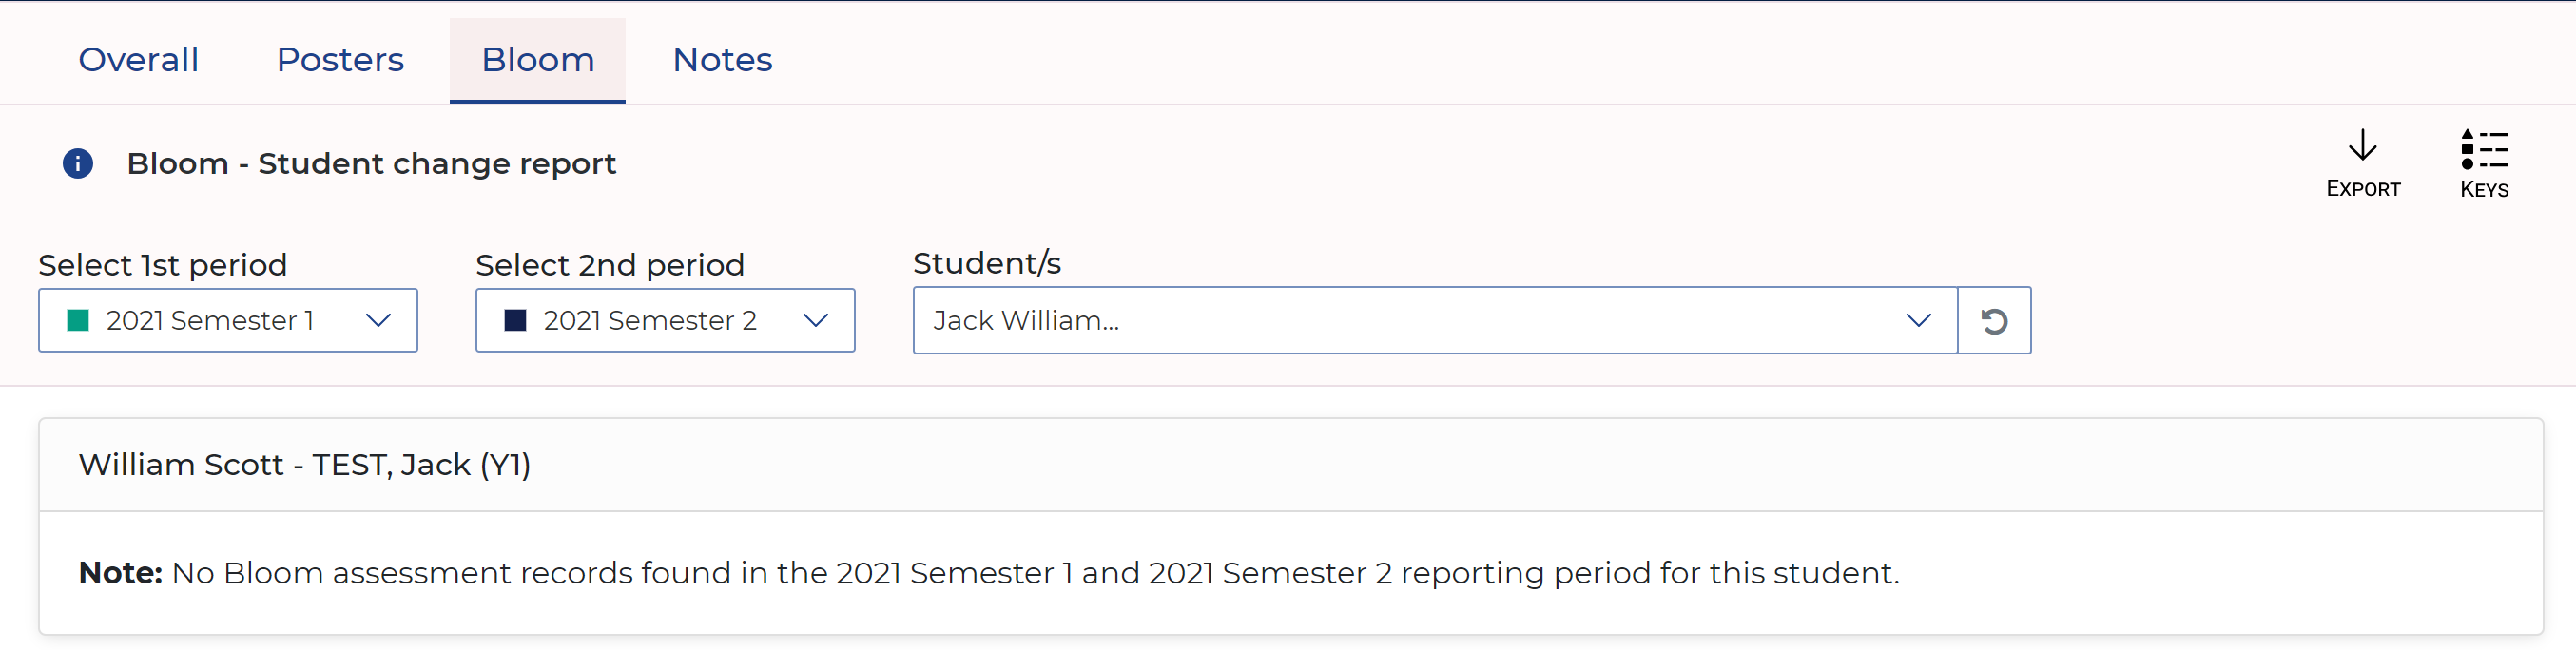
12. If multiple Bloom records are found for the selected assessment period then the latest record which was modified is displayed. This applies to both of the assessment periods.
13. You can export the data displayed in a PDF format by clicking on the Export button. Each student data is displayed on a separate page in the PDF.

Did you find it helpful?
Yes
No
Send feedback Sorry we couldn't be helpful. Help us improve this article with your feedback.